
Gold is trading in a remarkably tight range around US$4,000 to 4,100, while silver continues to coil around US$57. On the surface, very little appears to be happening, but prolonged sideways consolidation after a sharp correction is often where the next major opportunity is created.
The weak speculative longs have already been flushed out, positioning has been substantially reset, and sentiment has swung from excessive optimism to outright negativity.
Silver has now held within a defined range, approximately US$54.80 at the lower end and the low US$60s above, for nearly six-weeks now into early August. When a market absorbs every piece of negative news thrown at it and still refuses to break lower, that is rarely genuine weakness.
More often, it is a spring being steadily compressed.
I strongly believe both gold and silver are now preparing for their next major leg higher.
The objective is to weigh all the evidence, hard fundamentals, technical structure, price action, positioning and overall sentiment, and then begin building exposure if price levels demonstrate significant value, before the next significant move develops. Once price confirms the trend, we can then increase our allocation more decisively and average into strength.
Historical Precedents
At present, silver has suffered the third-largest six-month price correction in the last 70 years.
I looked at the top-ten price corrections lower over the last 70 years. Today comes in at number 3, nearly at par with number 2.
Number 1:
The largest correction occurred in 1980 , after silver had rallied approximately +4,400% into the end of that commodity cycle. That sell-off was completely understandable , given the scale of the prior repricing and the fact that the cycle had effectively ended .
However, even then , silver immediately staged a 126% price rally after that initial major fall, because markets never move in a straight line . Technically, it had become extremely oversold before the next leg lower unfolded. The high was seen in January 1980 and just 5-months later found a base after falling -79% and then rallied +126% over 3 months.
Number 2:
The second-largest correction took place during the 2008 Global Financial Crisis. Again, that was wholly understandable, as every major asset class was being liquidated and raising cash liquidity became king. Silver fell -59% over 7-months, then immediately thereafter rallied +72% in just 4 months, before eventually delivering a much larger +500% advance into early 2011.
Number 3:
The third-largest historical correction we are presently in the midst of, or I would gently suggest this wave lower is now exhausted at this time.
Over the last 7-months (same correction time period as 2008), silver’s decline has closely mirrored the 2008 GFC collapse, falling short of that overall drawdown by less than 3% to date. Silver has declined in full -56% and yet every fundamental reason to own silver has only increased.
From a time-cycle perspective, this corrective wave is now extremely mature, long in the tooth and increasingly looks exhausted.
So, based purely on simple mathematics, chart history, and oversold technical metrics, every comparable major silver sell-off over the last 70 years has been followed by a significant rally.
In my view, the message is very clear here:
A major silver rally is coming.
And that is before we even account for the most important fundamental difference today, silver is now in a structural global supply-demand deficit and more accurately is in a major bullish trend cycle that has many years to run yet, for all of the fundamental and mathematical reasons I have spelt out very clearly over the last many weeks, months and years.
How Undervalued is Silver ?
The CPI on the ‘ ShawStats ’ real inflation metric which is an Alternate Data Series reflecting the CPI as if it were calculated using the methodologies in place in 1980.
As we know CPI has been manually adjusted constantly by the US to reflect / manipulate weaker inflation numbers than it actually is.
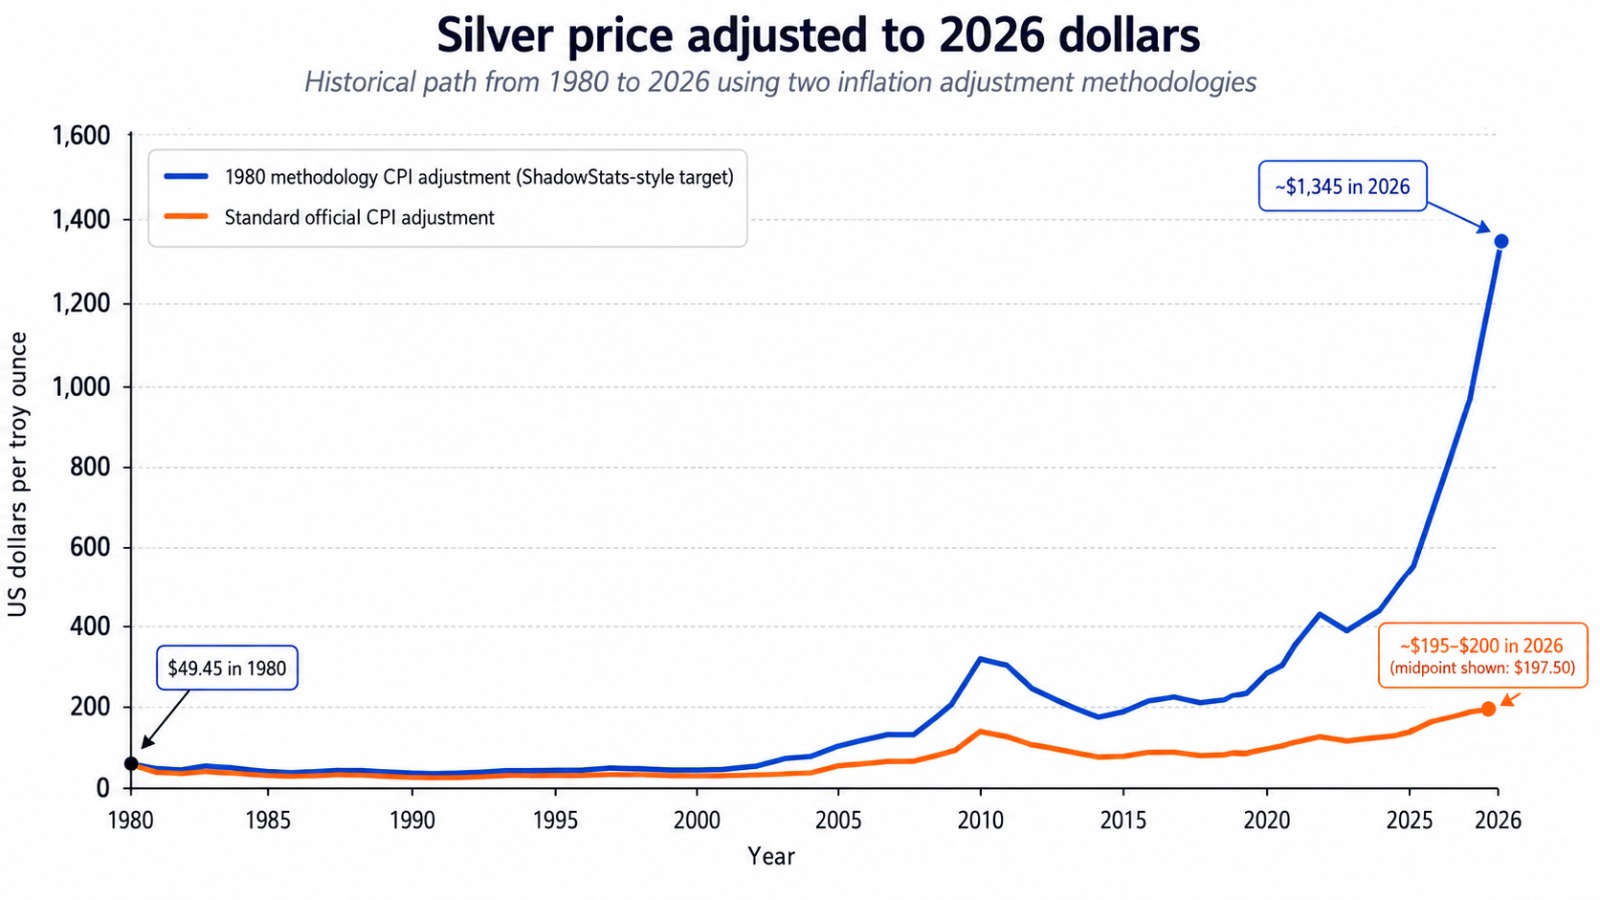
An inflation-adjusted silver price of approximately US$1,345 per ounce in today’s dollars may initially appear extreme. So let us examine the market through another valuation lens.
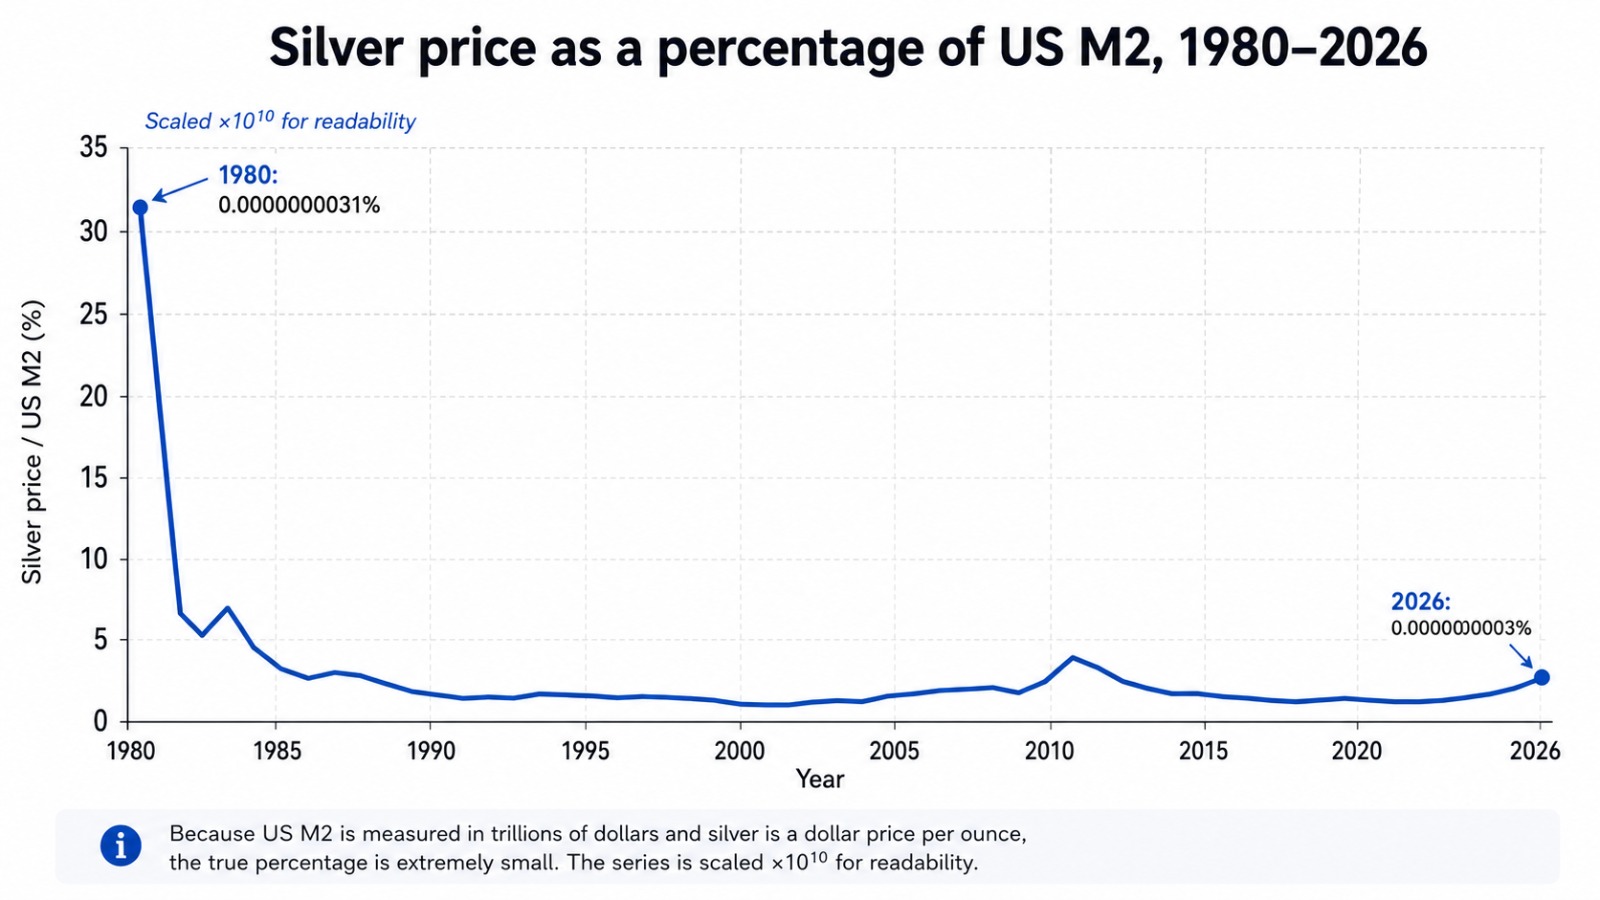
Using official US M2 money-supply data and comparing silver’s price relative to the total stock of money, silver remains undervalued by at least ten times when measured against its 1980 peak.
Even this comparison fails to capture the profound structural changes now taking place in the silver market: persistent supply deficits, declining readily available inventories and rapidly expanding industrial demand across energy, electrification, technology and infrastructure.
Whichever valuation metric you choose, the conclusion remains the same:
Silver is not merely undervalued – it is ludicrously undervalued.
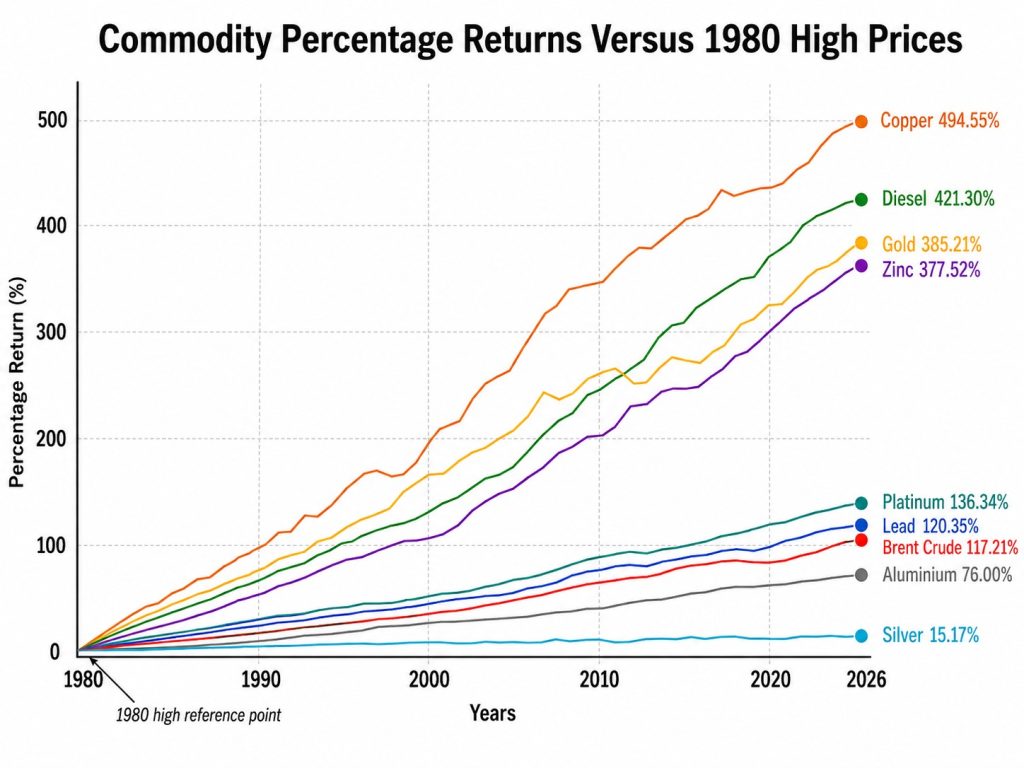
Another useful measure is to compare each commodity’s 1980 high price with its current level as of 4th August 2026.
The relevance here is important: the majority of global silver production comes as a by-product of copper, zinc, lead, and gold mining.
Diesel is also a major input cost across global mine production.
So when we compare silver against these related commodities, the question becomes very simple:
Can you see the serious undervaluation in silver?
Part 8. will follow in the series.