

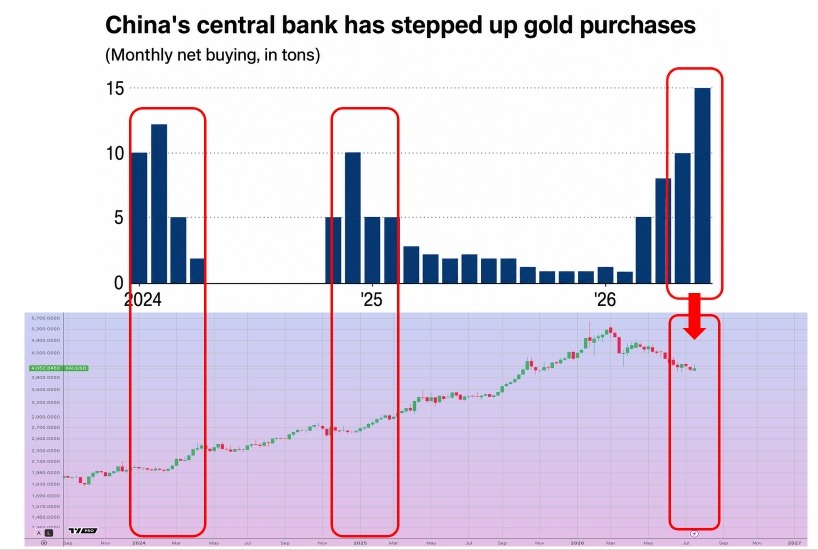
Firstly, let us examine the People’s Bank of China’s officially reported gold purchases in the bar chart, see below, alongside the US-dollar gold price chart just below the bar chart.
The historical pattern is remarkably clear: China tends to accumulate gold aggressively before major price advances, then reduces or stops outright its reported purchases once the market is already rallying.
China is now buying heavily once again.
So, what does that tell us?
It strongly suggests that the People’s Bank of China sees current gold prices not as expensive, but as an opportunity to continue accumulating ahead of what it may believe will be the next significant move higher.
Now let us look at the seasonal trend of price action, which I have often updated over the years with my subscribers.
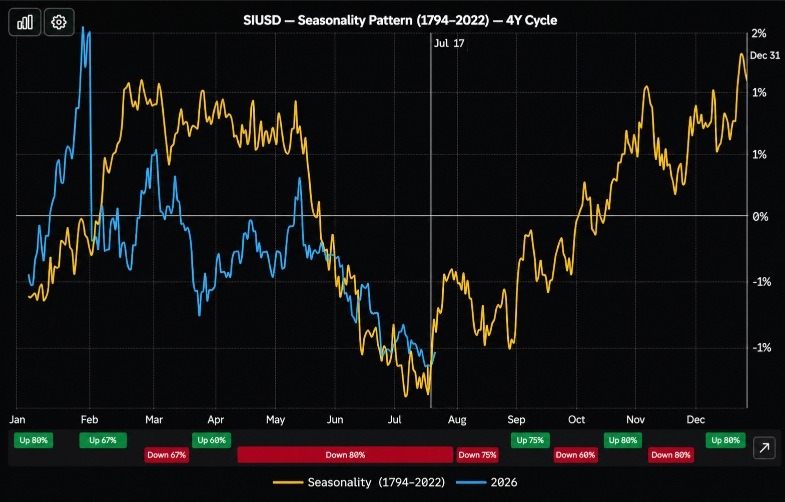
This is a 4-year Cycle Seasonality Pattern in the chart below.
As you can clearly see from this chart, the seasonality pattern on 4-year cycles of gold pricing from years 1794 to 2022 is in yellow.
The blue trend line is the price action of gold for the year 2026 so far, into late July.
The four-year cycle seasonality pattern is to identify how gold has historically behaved during the same year of a repeating four-year market cycle.
Rather than combining every calendar year into one seasonal average, the analysis separates history and looks at every fourth year, ignoring the 3 years in-between
The price movements from matching cycle years are then averaged to create a historical seasonal roadmap.
Why four-year cycles may matter?
Four-year cycles are often associated with several recurring forces:
- The US presidential cycle: Government spending, fiscal policy and market confidence can change depending on the stage of the election cycle.
- Monetary-policy cycles: Interest rates, liquidity conditions and central-bank policy often move through multi-year periods of tightening and easing.
- Economic cycles or approximately 50% of a full Pi Cycle: Growth, inflation, recession risk and credit conditions frequently develop over several years rather than within one calendar year.
The 4-year cycle seasonality pointed to July 17 as the bottom. Will it demonstrate a low this time in 2026?
Quantitative easing—money printing—is back. Click here to read part 5
Goldman Sachs bank reporting of the enormous buying of gold by China coming next Part 6.……..