Back Up the Truck — An Enormous Buying Opportunity (Part 1)
I warned that we could see a correction and retest of the major technical price chart neckline in silver, the former 45-year resistance line from 1980 to 2025, which has now become major support in the US$52 to US$57 region.
The silver chart below is directly from https://northstarbadcharts.com/ , its saves me time from producing my own chart as time is limited for me today.
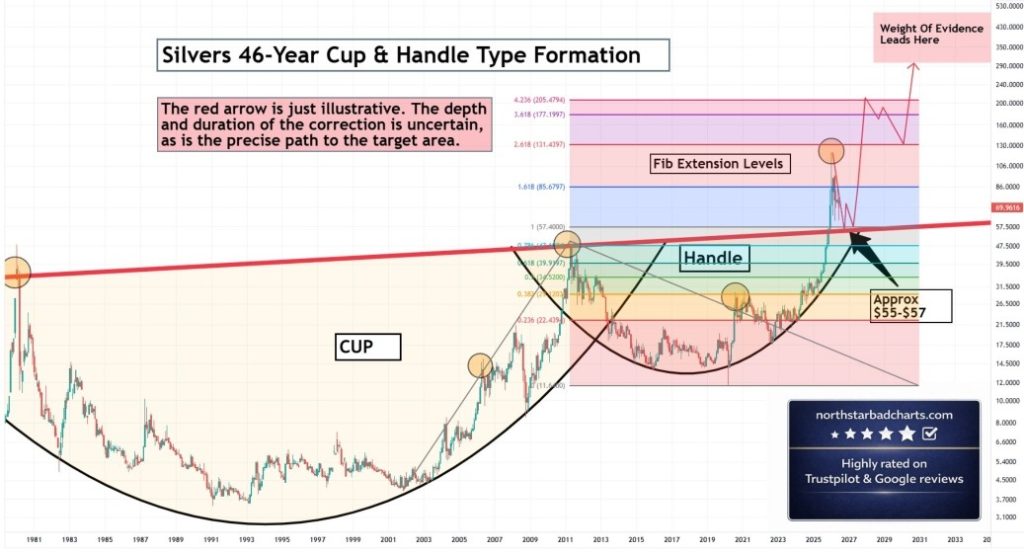
After silver moved close to US$122 by January , I was not sure how feasible it would be to revisit down again to those levels standing at 52-to-57 US$ levels. But I made the point very clearly: if we did see that extremely strong support zone lower again, it would be a back-up-the-truck-and-load opportunity.
Technical indicators we are looking at are extremely oversold and are at historical precedents.
Financial markets may literally be the only markets in the world where customers not only run out of the store when the goods go on sale, but sell them at or near historical lows.
Both silver and platinum have corrected in a fairly dramatic fashion. Going back through history, this type of opportunity is rare, which I will follow up with hard data in my next update today.
So what exactly has changed?
The answer is very simple: nothing whatsoever.
- The global supply-demand deficits in both silver and platinum remain severe.
- Silver is now in its sixth consecutive year of deficit, while platinum is in its fourth consecutive year of deficit, with further deficits projected well into the next decade.
- Capital expenditure across the mining industry remains negative to neutral. In fact, these price corrections only reinforce the problem. Investors and mining companies require long periods of price confirmation before committing serious capital to new ore-grade supply, and even when that capital is committed, it takes many years for new production to reach the market.
- Geopolitical tensions have not disappeared. They have intensified.
- Deglobalisation has not reversed. It has accelerated.
- Global sovereign fiscal deficits have not improved. They have worsened.
- The global debt and leverage crisis is not dissipating. It is escalating.
This brings us back to the core macro problem.
The Federal Reserve (alongside global central banks) is trapped under the hammer of fiscal deficit dominance , and the same applies to most of the industrialised world.
When inflation is driven by structural supply deficits, war-driven energy shocks, de-globalisation, and exploding government expenditure, raising interest rates does not solve the problem. It simply accelerates the debt spiral by increasing debt-servicing costs.
That is the trap!
- Higher rates do not create new physical silver supply.
- Higher rates do not create new physical platinum supply.
- Higher rates do not rebuild heavily depleted inventories.
- Higher rates do not alter whatsoever the global infrastructure requirements requiring these metals in the first place.
- Higher rates do not reverse years of major underinvestment in mining.
- Higher rates do not fix fiscal deficits, they make them worse.
- Higher rates do not stop governments from spending money they do not have.
So when silver and platinum correct sharply, investors need to ask the right question.
Has any point of the structural thesis broken?
Or has the market simply offered a rare opportunity to buy exceptional finite and limited assets at a major discount?
In my view, this is not a breakdown in the thesis. This is a gift.
Back Up the Truck — What History tells Us? (Part 2)
Looking back at historical negative price moves in silver over rolling six-month periods since the major precious metals cycle peak in 1980, the current sell-off is significant.
During the 1970s, silver delivered an extraordinary rally of approximately 44 times, culminating in the 1980 cycle high. Since then, silver has experienced several major corrections, but the key question today is this:
How sustainable is the current sell-off, and does it align with historical seasonal and cyclical patterns?
Based on historical price analysis, the present decline ranks as the third-largest silver sell-off since 1980. The largest remains the collapse following the 1980 peak, while the second-largest occurred during the 2008 Global Financial Crisis, which only marginally exceeded the scale of the current move.
However, there is one major difference today.
During previous major silver sell-offs, the physical market was generally supported by a healthy global supply-demand surplus . That is not the case today.
Silver is now entering its sixth consecutive year of structural deficit , meaning the current price correction is taking place against a fundamentally tighter physical market backdrop than in any previous major declines.
That distinction is extremely important.
For complete clarity…
Bull market = prices are trending higher in a cycle time frame.
Bear market = prices are trending lower, in a cycle time frame.
=====
Bear Market Cycle – From Major Cycle High
From 1st January 1980 (6 months period) ; Silver fell -77.50%
Thereafter Silver rallied +124.54% over the next 4 months.
=====
Bear Market Cycle
From 1st January 1981 (6 months period) ; Silver fell -47.90%
Thereafter Silver rallied +35.94% over the next 3 months.
=====
Bull Market Cycle – Aligned itself with Global Financial Crisis
From 1st July 2008 (6 months period) ; Silver fell -56.56%
Thereafter Silver rallied +63% over the next 4 months.
Ultimately rallying +580% into 2011.
=====
Bear Market Cycle – From Major Cycle High
From August 2011 (6 months period) ; Silver fell -41%
Thereafter Silver rallied +34% over the next few months.
=====
Bear Market Cycle
From 1st Jan 2013 (6 months period) ; Silver fell -43.83%
Thereafter Silver rallied +37.71% over the next few months.
=====
Major Bull Market Cycle
From 1st Jan 2026 (6 months period) ; Silver has fallen -54.27% as of 25th June.
Where now?
Disclaimer: This commentary is provided for informational purposes only and does not constitute financial advice or a solicitation to buy or sell any investment products. While every effort has been made to ensure accuracy, Indigo Precious Metals Group and Auctus Metal Portfolios accept no liability for any losses arising from reliance on the information contained herein. Clients should seek independent professional advice before making any investment decisions.