How undervalued is gold at today’s levels?
By David J Mitchell
10th September 2025
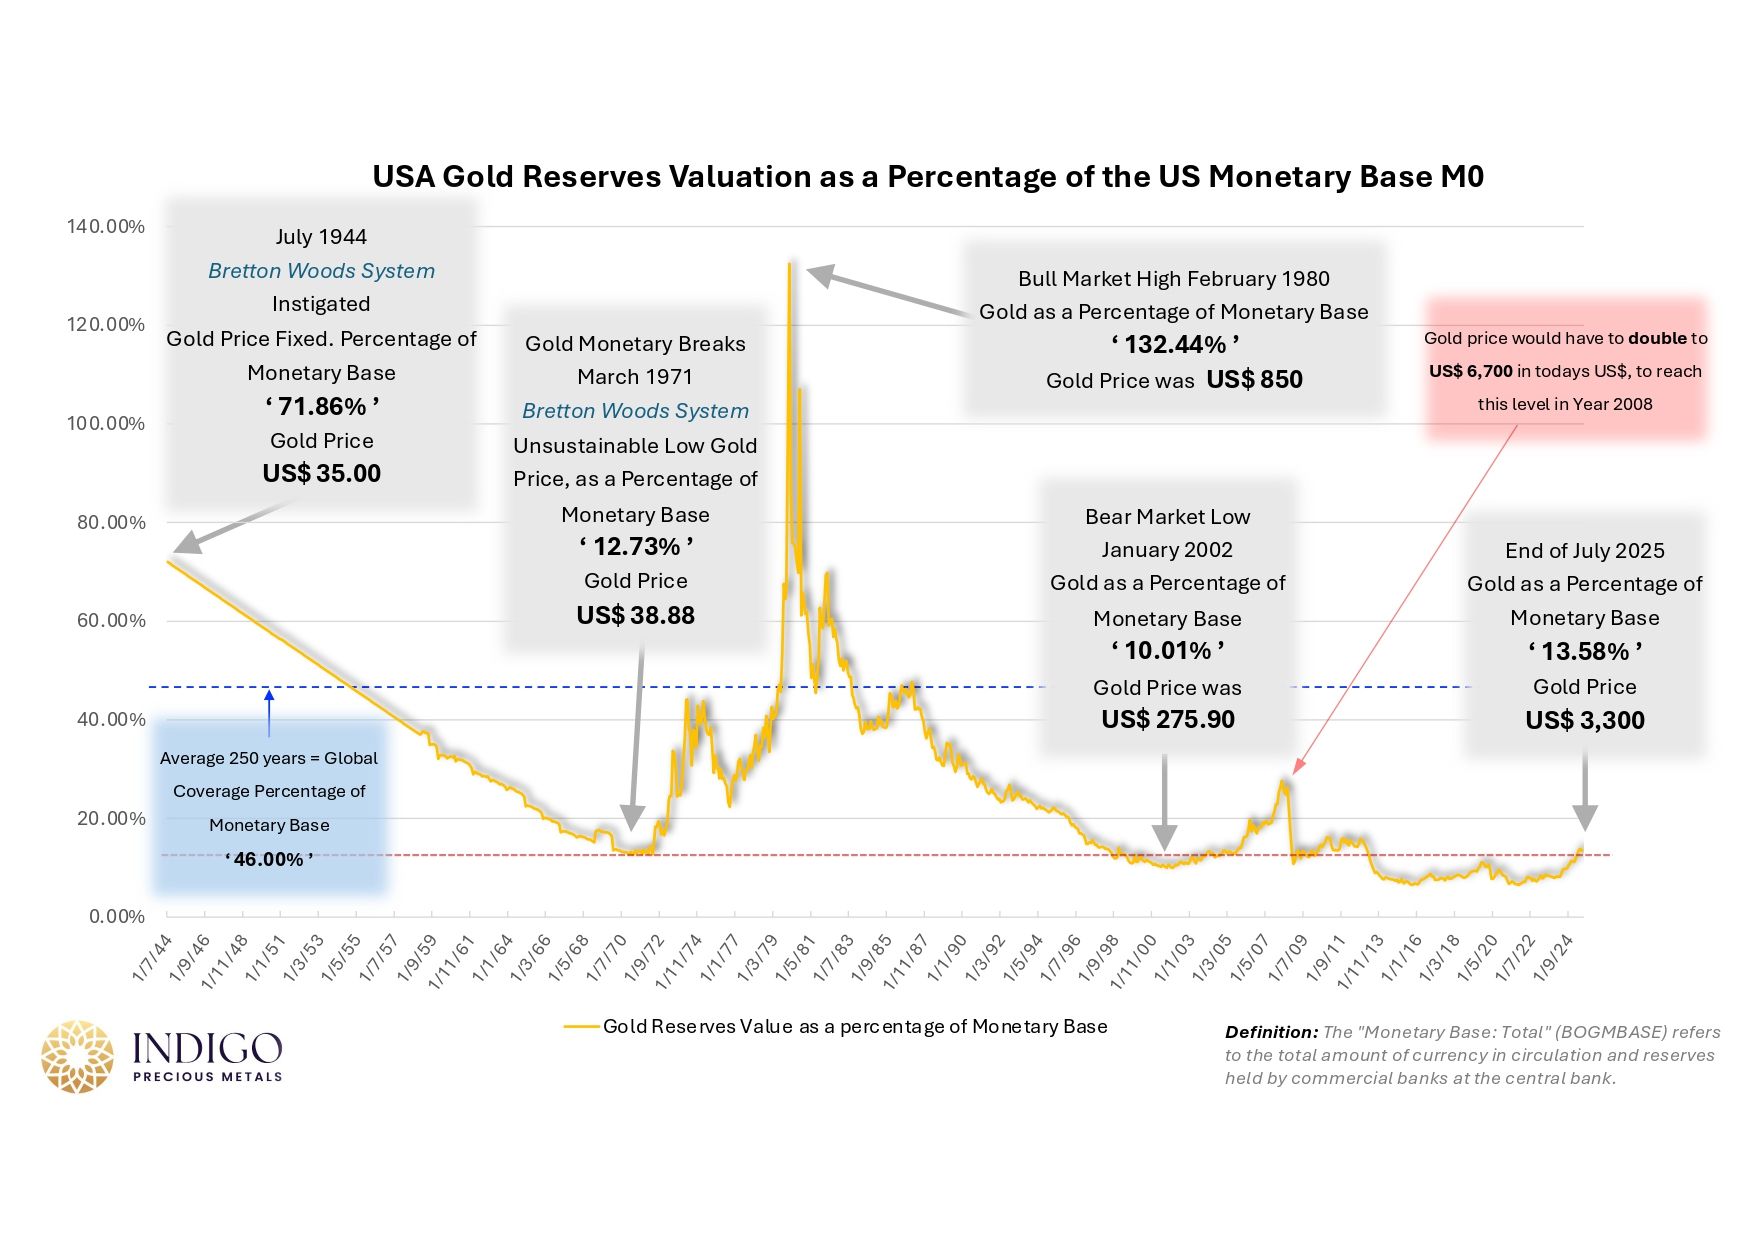
Gold remains undervalued at current levels, according to my latest analysis at Indigo Precious Metals here in Singapore. My comprehensive study of Federal Reserve data spanning over 80 years reveals that gold would have to surge to US$32,000 per ounce in today’s US$ to simply match the highs seen in 1980, based on historical monetary base ratios — representing a potential 1,200% gain from today’s levels.
As gold powers through US$3,650, investors, portfolio managers, and analysts are grappling with the same question: what represents a realistic valuation metric for gold in this cycle?
Major investment banks such as Goldman Sachs, Bank of America, and UBS continue to chase price momentum, constantly revising their targets higher. Their approach is more reactionary than analytical, simply following the momentum trend rather than addressing the structural forces driving relentless central bank gold accumulation.
Gold Analysis Should be Relevant
Over the last decade has seen profound shifts in the gold market, driven above all by an unprecedented surge in net central bank gold purchases over the past 15 years.
This raises critical questions that cannot be ignored:
-
What are the true motivations behind central banks’ relentless accumulation of gold?
-
How should we understand gold’s strategic role within the global monetary base?
These are not abstract debates — they are central to understanding where valuations may head in this secular revaluation cycle through the end of this decade.
Gold Price Valuation Targets Explained
The most direct — and arguably most powerful — way to frame where gold is heading is through a simple ratio analysis: comparing Base Money (M0) against sovereign-held gold reserves, valued at current market prices. This relationship provides one of the clearest lenses into gold’s true valuation potential. I’ll break down exactly why this metric matters — and what it reveals — further into this article.
My chart work is built from three key variables, each exhaustively cross-checked and audited across multiple datasets:
- Monetary Base (M0): Downloaded from the Federal Reserve database, capturing monthly data since 1944.
- U.S. Gold Reserves: Sourced from Federal Reserve and U.S. Government records, reflecting the active month-by-month management and ownership of sovereign-held gold holdings in Troy Ounces, which has changed quite dramatically over the years and decades.
- Gold Prices: Monthly closing price of gold in U.S. dollars, compiled back to 1944

The integration of these 3 datasets provides a unique long-term perspective on monetary expansion, sovereign gold strategy, and the evolving valuation of gold.
Federal Reserve Data Reveals Gold’s True Value
Integrating these three datasets provides me with a unique long-term perspective on monetary expansion, sovereign gold strategy, and gold valuation.
Key takeaways from my analysis:
-
At US$3,078 (July 2025), gold trades at the same low ratio last seen in 1971 — right before the explosive revaluation of the 1970s into 1980.
-
To match the 2008 ratio highs, gold would need to rise to US$6,695.
-
To align with the long-term average of global coverage ratios across past monetary systems, gold would need to achieve US$10,900 (assuming no further M0 growth, which is extremely unrealistic).
-
To revisit the extreme ratio highs of 1980, gold would have to surge toward US$31,930.
The implication is clear: even without further monetary expansion, gold remains deeply undervalued relative to historical benchmarks. And with ongoing monetary aggregate growth inevitable, these targets will only rise further.
Does This Analysis Hold Water?
One can always debate what the “fair value” of a commodity or asset class should be. Prices can and do fluctuate widely, especially when measured against the monetary base—or indeed against any other asset. But before considering valuations, it is critical to establish what gold actually is, and the role it plays in today’s fiat-based monetary system.
Gold is not just another commodity. It is formally recognized as a sovereign reserve asset, held by central banks and governments worldwide, who have been ‘net’ diversifying into gold every year since 2010 to today.
It is officially classified as money, as well as tier-one capital, alongside fiat currencies and sovereign bonds. Crucially, gold is also not only one of the most liquid assets on the planet, but has zero third party liability which is incredibly important.
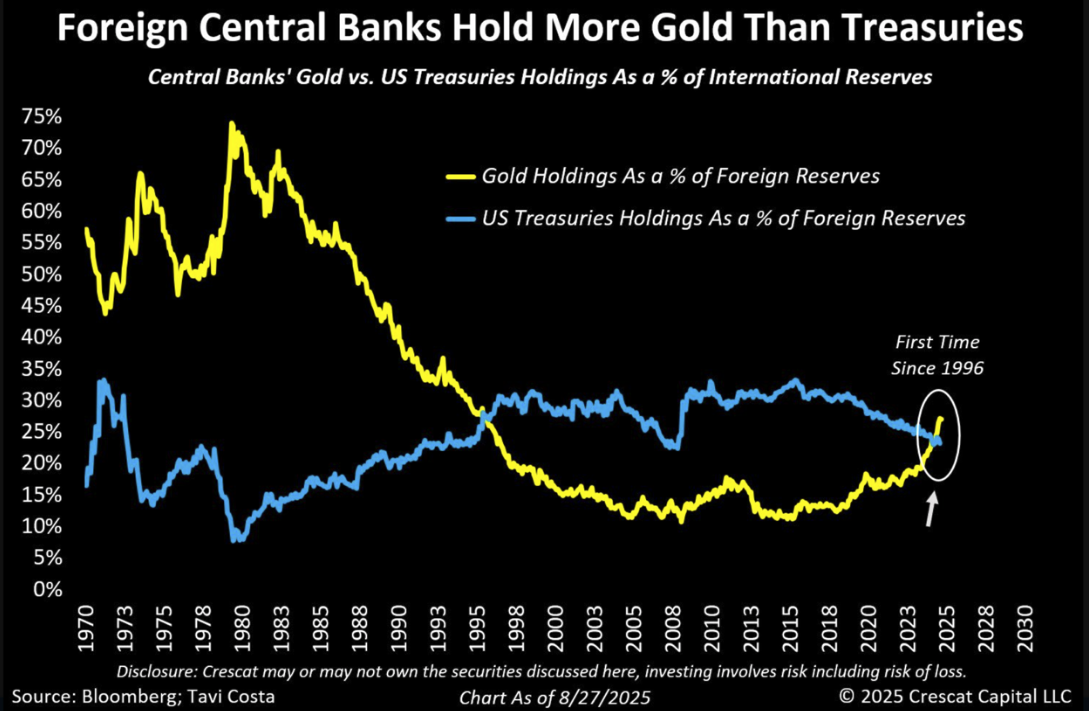
As a case in point, see the chart below. For the first time since 1996, foreign central banks now hold more gold than U.S. Treasuries. Think about the magnitude of that shift. And if you believe this accumulation trend is nearing an end, history offers a clear reminder—just look at the powerful buying wave of the 1970s.

Gold as a Store of Value
Under a gold standard (we are NOT saying we are reverting back to a gold standard), money fulfilled three essential functions:
- A medium of exchange
- A store of value
- A unit of account, providing a stable benchmark against which goods and services could be priced.
Our present Fiat currencies, by contrast, have performed very poorly in the latter two roles. By continually expanding monetary aggregates, governments systematically erode the intrinsic value of their currencies. The longer one holds fiat money, the more purchasing power is lost.
The numbers are stark: since the establishment of the Federal Reserve in 1912, the U.S. dollar has lost nearly 98% of its purchasing power. Gold, on the other hand, has multiplied more than a hundredfold in price. Far from being speculative, this rise simply reflects gold maintaining its purchasing power.
Put differently, an ounce of gold today buys roughly the same basket of goods and services it did a century ago.
History shows a consistent pattern: when the money supply expands, gold prices in the unit of currency rises to compensate. The more paper and digital currencies that are created, the more units of currency it simply takes to purchase the earth’s finite and limited supply of gold.
Gold Price Forecast
You cannot analyse a market — or any asset class — in isolation. True understanding requires framing it within the broader landscape of macroeconomic analysis, because no market functions independently; every price is shaped by the larger forces at play.
Our research makes this abundantly clear: gold is only at the beginning of its latest cycle journey, one that is set to unfold powerfully into the end of this decade and well into the early years of the next.
Time in the market is better than timing the market.
For exclusive insights and personalised portfolio strategies, I invite you to work with me and the team at Indigo Precious Metals, Singapore’s leading bullion specialists.


