
A Seasonal Transition — and a Cyclical One
Happy Lunar New Year to our Chinese friends — gōng xǐ fā cái.
The Lunar New Year marks more than the turning of a calendar page. It represents the commencement of a new 60-year zodiac cycle. We now enter the Year of the Fire Horse, following the Fire Snake — a symbolic transition historically associated with acceleration, intensity and momentum.
Markets, too, operate in cycles. And what we are witnessing today in silver and precious metals is not a seasonal fluctuation, but something far more structural.
Over recent days I waited patiently for a meaningful pullback to add to positions. Yet I began to question whether the widely propagated “Chinese New Year holiday sell-off” narrative would prove misplaced.
There was considerable chatter suggesting Western bullion banks would pressure paper prices lower during China’s nine-day holiday. Simultaneously, claims resurfaced that silver is in a “bubble” — a view I find fundamentally flawed.
What stood out most was not the commentary itself, but its tone.
Sentiment across much of the market was notably bearish. History repeatedly shows that when consensus leans heavily in one direction, it often becomes a powerful contrarian indicator. Markets rarely reward the obvious narrative.
Technically, the structure remained constructive. Momentum indicators, RSI and histogram readings suggested consolidation within an advancing trend — not exhaustion.
We were operating in a period of transition. Not only seasonally, but cyclically.
And in such moments, markets tend to surprise the majority.
Two Superpowers. One Message. Critical Metals Are Strategic.
While short-term traders focused on volatility, the real story unfolded in the physical world.
Vice President Vance recently informed more than 50 nations that the United States intends to establish coordinated price floors under critical minerals, including silver, platinum, copper and rare earth elements — materials China has dominated through refining capacity for years.
This is not rhetoric.
It is policy.
The United States has launched a major strategic initiative, committing $12 billion in initial seed funding to build a national stockpile of essential materials under what is now being referred to as Project Vault.
The objective is clear:
Protect U.S. manufacturers from supply disruption.
Reduce strategic dependence on China.
When governments begin discussing price floors and stockpiles, we are no longer in a normal commodity cycle.
We are in a geopolitical metals cycle.
Meanwhile, China Moves Quietly
Just days before the Lunar New Year holiday, the Shanghai Futures Exchange announced a significant rule change effective February 27, 2026.
On the surface, it appeared technical. In reality, it was deeply revealing.
Futures contracts enter what is known as a “delivery month.” Historically, many participants hold contracts close to delivery before rolling or closing.
Under the new rule:
- If you are not an approved industrial hedger,
- Your position will automatically be reduced to zero in:
- The delivery month
- The month preceding delivery
Unless you have explicit pre-approved hedging quota, you cannot hold positions near delivery.
Only genuine industrial users remain.
In simple terms:
The exchange is tightening control over who can access physical silver.
This is not how exchanges behave in surplus conditions.
This is how they behave when inventories are tight.
SHFE registered silver stocks have fallen below 350 tonnes — the lowest level in more than a decade and roughly 89% below the 2021 peak.
At the same time, extreme backwardation persists. Near-dated contracts trade at significant premiums to distant months — the market’s signal of urgency for immediate supply.
China is clearly prioritising domestic industrial demand — solar manufacturing, EV production, electronics — before inventories become critically strained.
Two Systems. Same Signal.
On one side:
The United States is preparing price floors and building reserves.
On the other:
China is restricting delivery access and conserving physical supply.
Both actions send the same underlying message:
Critical metals are no longer simply commodities. They are strategic assets.
Structurally, that is very bullish.
Short-term volatility may remain. Administrative changes may dampen speculative pressure temporarily. But when physical supply is being ring-fenced by governments and exchanges simultaneously, price ultimately adjusts to reflect scarcity.
This is no longer a paper market story.
It is a geopolitical supply story.
And those rarely resolve quietly.
Technical Breakouts Confirm the Structure
On 13th February, I shared a chart outlining a prospective Reverse Head & Shoulders formation, targeting approximately US$100 silver in the short term.
That confirmation has now arrived.
The breakout occurred around US$78.50, clearing a down-trending neckline. Once price cleared that structure, the technical signal was triggered.
My immediate short-term targets became:
- US$99
- US$104
Over more than three decades of applying technical analysis, one formation has consistently delivered when traded with discipline: the Head & Shoulders pattern.
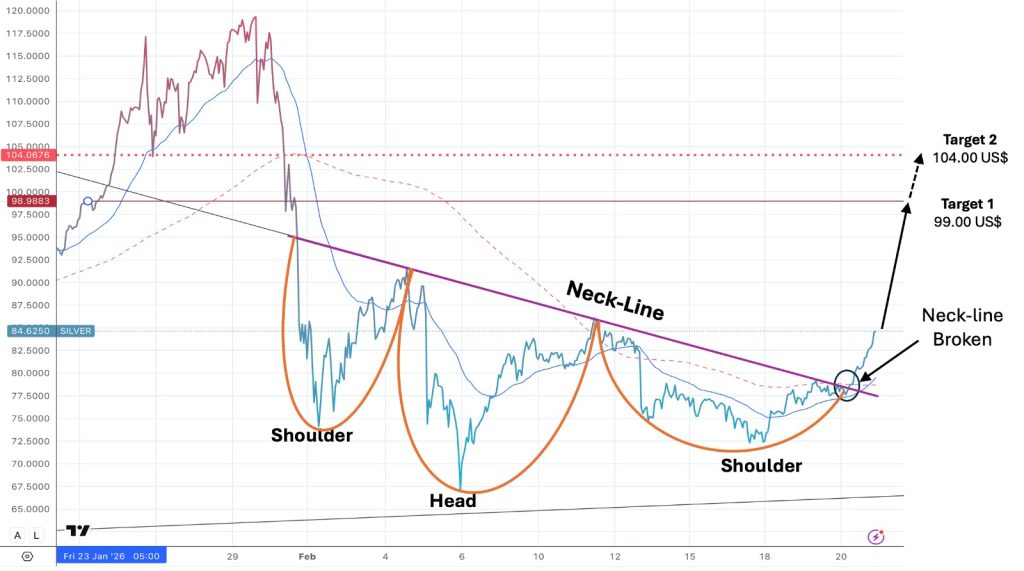
Silver has just completed the bullish counterpart.
Short-term volatility will always exist. But structurally, silver continues to strengthen beneath the surface.
Gold Structure: Cup & Handle
Gold is quietly forming a classic Cup & Handle pattern.
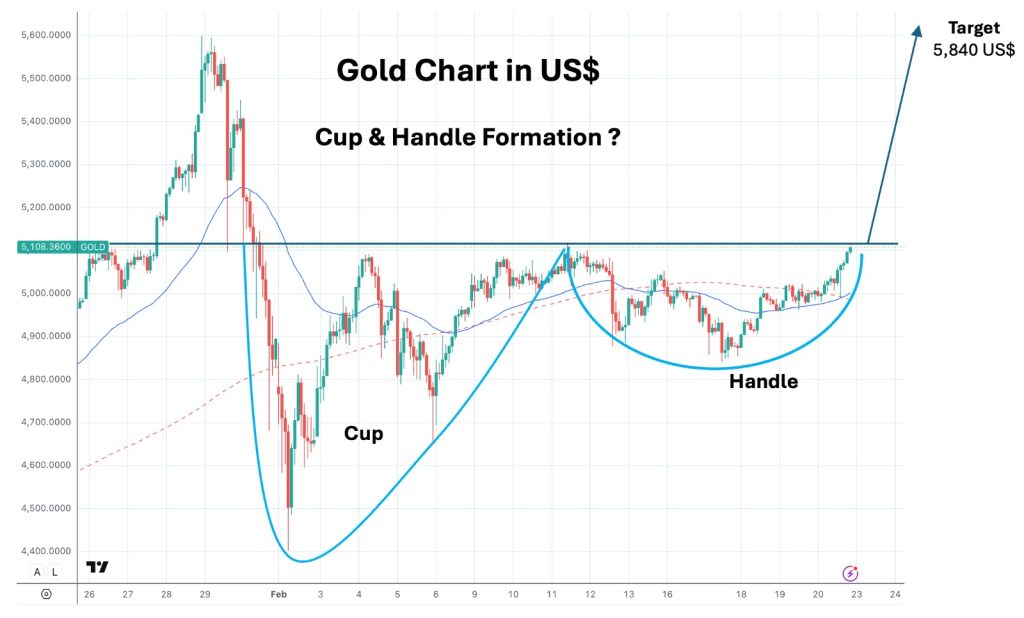
Horizontal resistance sits around US$5,120.
A decisive close above that level opens the path toward approximately US$5,840 — a potential new all-time high.
The measured target is calculated by projecting the vertical depth of the cup above the breakout level.
Confirmation matters.
But the setup is clearly on the table.
Do not ignore it.
The Gold–Silver Ratio
I continue to expect the Gold–Silver Ratio (GSR) to break lower, signalling accelerating outperformance in silver.
Even if the ratio holds near current levels:
- Gold at US$5,840 implies silver near US$98
If the GSR compresses toward 50 — entirely plausible in a strong metals phase:
- Silver projects toward US$117
A revisit of 43 (seen on 26th January 2026):
- Projects toward US$136 silver
In other words:
Silver does not require an aggressive ratio collapse to justify upside.
But if the ratio breaks lower — the move becomes materially more powerful.
24th February — Price Update
Silver traded to an intraday high of US$89.05, and is currently easing back toward US$88.15 . This type of retracement is entirely normal within a strong advancing trend, markets rarely move in straight lines.
As highlighted over the weekend, gold has now broken decisively higher, with silver following in tandem. The technical structure remains constructive, and I continue to believe there is further upside potential in the near term.
Supply Risk Is Real
Beyond price action, the broader backdrop remains supportive.
Mexico, which produced 202.6 million ounces of silver in 2024, making it the world’s largest silver producer, is currently experiencing significant internal instability. Disruptions in key mining regions have begun to affect operations in areas central to global silver supply.
At the same time, geopolitical tensions continue to escalate in the Middle East, with increasing military positioning and rising uncertainty around potential regional conflict.
These developments matter.
Silver is not simply a traded instrument, it is a physical commodity with concentrated supply sources. When major producing regions face instability, risk premiums inevitably begin to build into pricing.
In short, while short-term volatility is normal, the broader geopolitical and supply dynamics are contributing to a firmer structural foundation beneath metal prices.
Physical Market vs. Casino Paper Market
As of 24th February (SGT 14:08 PM):
- Shanghai Exchange (physical silver): USD 101.38
- Western COMEX (paper silver): USD 88.55
That is a USD 12.83 premium, or roughly 14.50%, between a delivery-based physical exchange and a paper-dominated Western market.
Let that sink in.
A 14.5% divergence between physical and paper pricing.
This is not typical behaviour in a balanced market.
It reflects tightening supply, strong physical demand, and structural stress beneath the surface.
Final Thoughts
We are no longer operating in a conventional commodity environment.
We are in a strategic metals cycle.
Governments are stockpiling.
Exchanges are restricting delivery access.
Inventories are falling.
Technical structures are breaking higher.
Physical premiums are expanding.
Short-term volatility will continue. But structurally? This bull market is not finished.