THE END GAME: Central Bank Precious Metals Supply Evaporates
The Central Bank policy of dumping precious metals onto the market to rig prices has come to an end. Soon, Central Banks will no longer have the ability to control the paper price of gold and silver as true market fundamentals will finally kick in. Unfortunately, when the decades long market rigging of the precious metals finally ends, most investors will not be prepared.
When we talk about Central Bank precious metal sales, most investors think of gold. However, Central Banks supplied a great deal of silver into the market over the past 50+ years. The United States was the world’s “Silver Sugar Daddy” during the 1960’s. I am putting together THE SILVER MARKET REPORT explaining this in detail.
As the U.S. Government depleted the last of its stocks of silver in the 1990’s, China, India and Russia supplemented the market over the past decade. This chart below, is from my THE SILVER CHART REPORT showing the Net Government Silver Sales since 2003:
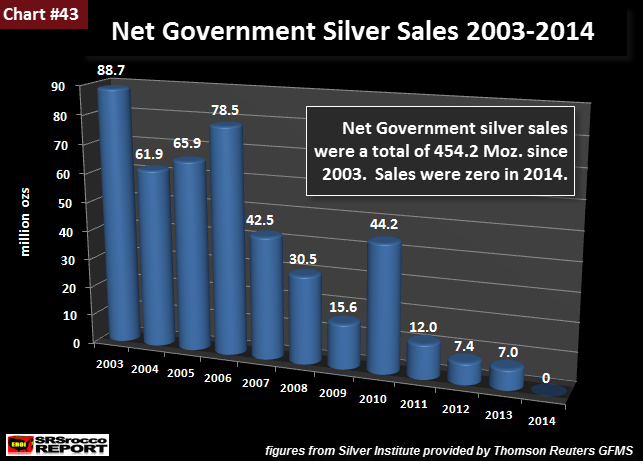
From 2003 to 2013, these three governments (mostly China) sold a total of 454.2 million oz (Moz) of silver into the market. As we can see, net government silver sales were the highest from 2003 to 2006, continued to decline until 2013, and then dropped to zero by 2014.
If we combine Central Bank gold and silver sales over the same time period, we find a distinct change:
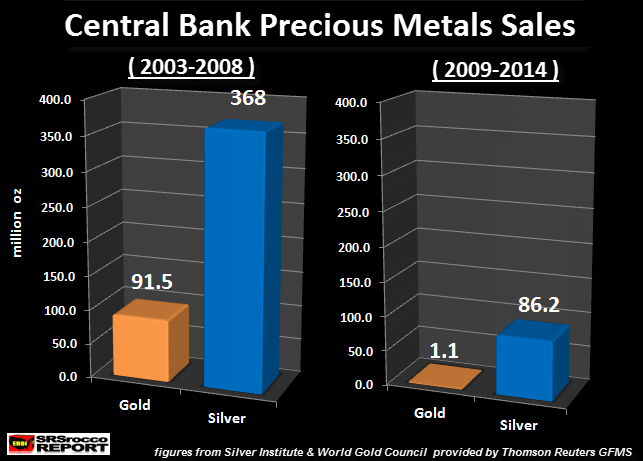
From 2003 to 2008, Central Banks sold 91.5 Moz of gold and 368 Moz of silver into the market. What is interesting to note here, is that the majority of gold sales came from Western Central Banks, while all the silver sales came from Eastern Central Banks. In a round-about way, the Western Central banks were supporting the gold price, while the Eastern Central Banks were supporting the silver price.
Of course, some investors would call this “manipulation hogwash”, but I can assure you… without Central Bank dumping of gold and silver on the market, the global fiat monetary system would have likely disintegrated years ago.
Now, let’s look at the gold and silver bars on the right hand side of the chart. After the collapse of the U.S. Investment Banking System and Housing Market in 2008, Central Bank gold sales dried up and silver sales declined significantly. From 2009-2014, Central Banks only sold 1.1 Moz of gold and 86.2 Moz of silver.
However, this is only part of the picture. While Net Government Silver sales continued until 2013, Central Banks actually starting buying gold in a big way in 2011. If we look the chart below, we can see the big change in Central Bank net gold purchases starting in 2010:
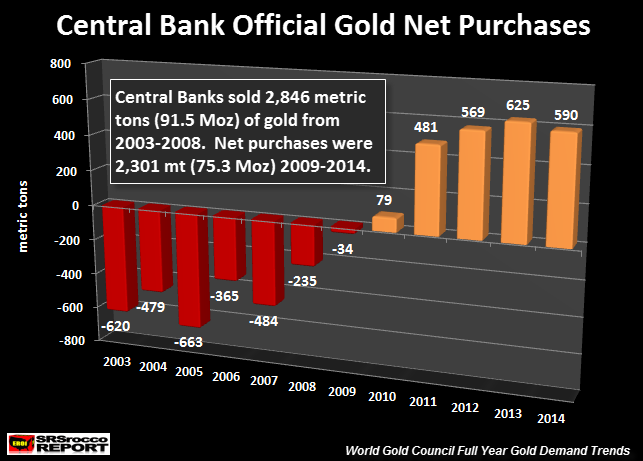
In 2009, net Central Bank gold sales were only 34 metric tons (mt), compared to 235 mt in 2008. As you scroll to the left of the chart, Central Bank gold sales reached a high of 663 mt (21.3 Moz) in 2005.
NOTE: Net Central Bank gold purchases shown in red are negative, because these figures represent sales into the market, while the gold-colored bars represent net purchases.
That being said, Central Banks dumped a total of 2,846 mt (91.5 Moz) of gold onto the market from 2003 to 2008, and consumed a net 2,301 mt (75.3 Moz) from 2009 to 2014. Here we can see a distinct change in net Central Bank gold purchases after the near meltdown of the U.S. and Global Financial System in 2008.
I believe the Central Banks (especially in the West) have run out of gold and silver to dump on the market. Thus, the END GAME for Central Bank precious metal rigging has arrived… it’s just a matter of time.
The huge volatility we are now experiencing in the oil and broader stock markets indicates BIG TROUBLE AHEAD. While some investors think it will take many decades for the Fiat Monetary System to unravel, I believe it’s just a matter of years…. maybe less.
If we see a serious collapse of the broader stock markets this fall, investors will likely ramp up their precious metals purchases in a big way. This will make the present shortage in the retail silver market even worse, thus causing it to spill over into the retail gold market.
The Great Precious Metals Reset is coming.
If you haven’t checked out THE SILVER CHART REPORT, there’s a great deal of information on the Silver Industry & Market not found in any single publication on the internet. There is one chart in this report (Chart #19) that I can guarantee that 99.9% of precious metal investors haven’t seen before.